Dead Sea Potash Production – Dyke stability and water seepages
Multisensory Survey
Objective of the Project:
Due to the geological conditions, the descent of the water level of the Dead Sea, the dissolving of underground salt layers, and the influence of the potash production south of the Dead Sea sinking processes endangering the stability of dykes along the ponds of the potash production. Sinkholes and dyke collapses coursing multimillion-dollar damages in the production facilities on the Israeli and Jordan site.
Potash producers and external geotechnical consultants were requesting a multisensory data set to get a more comprehensive dataset to forecast problem areas and the development of long-term strategies.
Technical Solution:
Dimap and the Israeli partner Ofek applied in a multiday flight operation over the area with more than 400 sqkm of a combination of multiple sensors:
- a Riegl 560 full waveform scanner to map the terrain data and generate a precise model for the structure of the terrain based on up to 8 pts/sqm.
- a wide-angle digital camera for the generation of 10cm orthophotos but also Multivision oblique datasets to have image material on cliffs.
- a highly sensitive thermal camera to measure temperature differences on the surface helping in identifying underground water seepages.
- Hyperspectral scanners in the range from 400 to 2500nm with more than 400 bands to support the identification of problem zones further.
By analyzing soil, salt, and water components.
The flight operations were supported by GPS and thermal ground truthing and the heritage data of the client provided further material during the analysis.
All data were produced GIS-ready to support a multivariate analysis using a scoring system for fast and efficient detection of problem zones.
Achievements:
The area was covered within 4 days of flying and the data processing of the raw data was finished within 6 weeks. The Lidar data allowed the fast identification of sinkholes and depressions (Figure 1). The data were accomplishing Satellite Radar-Interferometry results, allowing the identification of finer details than the Satellite data.
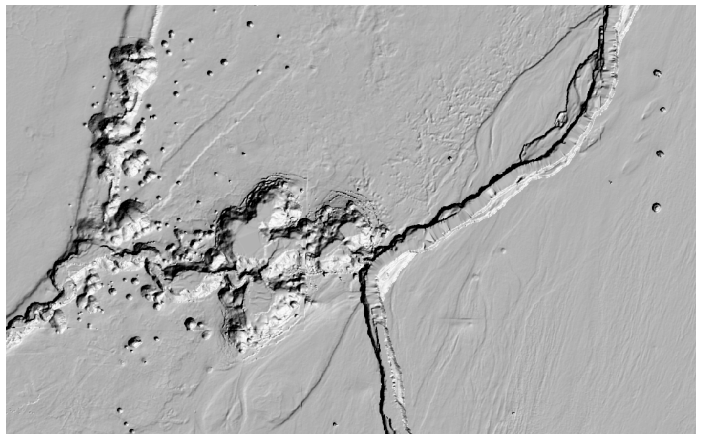
Figure 1: Depressions and sinkholes in different development stages. Contours in another target outline exactly the extension of developing depressions visible on the interferometry data.
In a parallel analysis, thermal data were visually checked against the orthophoto mosaic and anomalies were marked. The data allowed the detection of underground water (which is in the scene appearing warmer) and the mapping of seepages through the dyke as well as along fault lines (Figure 2).

Figure 2: In thermal data detected underground seepage of brine water through a dyke. While the orthophoto shows salt crusts from an earlier leakage on the surface the new seepage (arrow) is not visible on the terrain (right) or the orthophoto. It generates due to the underground warm water a signature (redder) on the thermal dataset.
The first work with the Hyperspectral data allowed the discrimination of salt and Carmelite as well as identifications of salt structures in the ponds and water depth estimations. During the next steps, hot spots and unclear situations of the geotechnical analysis like boiling points will be further analyzed. The base for this work is field ground truthing and hyperspectral laboratory samples.
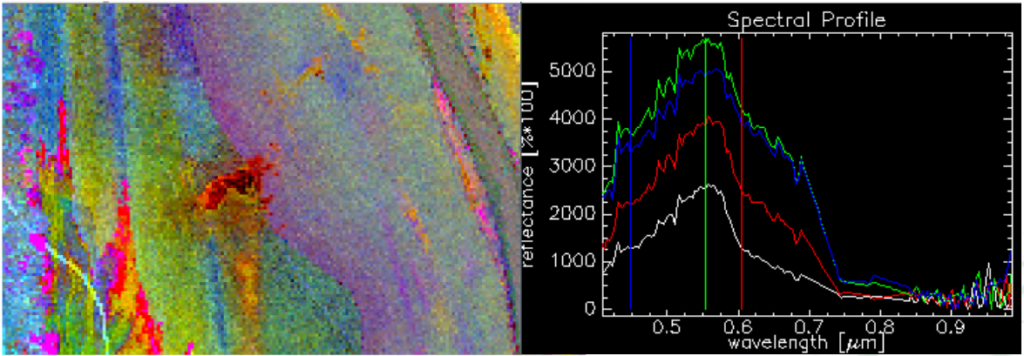
Figure 3: Different salt and Carmelite structures (red) used to identify the heritage of old seepages and typical spectrogram of Carmelite in different water depths in the pond.
In the final stage, the results of the individual problem areas were scored, summarized, and visualized in the GIS system. The data allowed the identification of structural danger zones and are the base for engineering work on the dykes.
Figure 4 shows the danger of geological fault lines for the dyke (right arrow). Figure 5 combines the results of different sensors and illustrates the power of the technology to understand complex processes of geotechnical relevance.
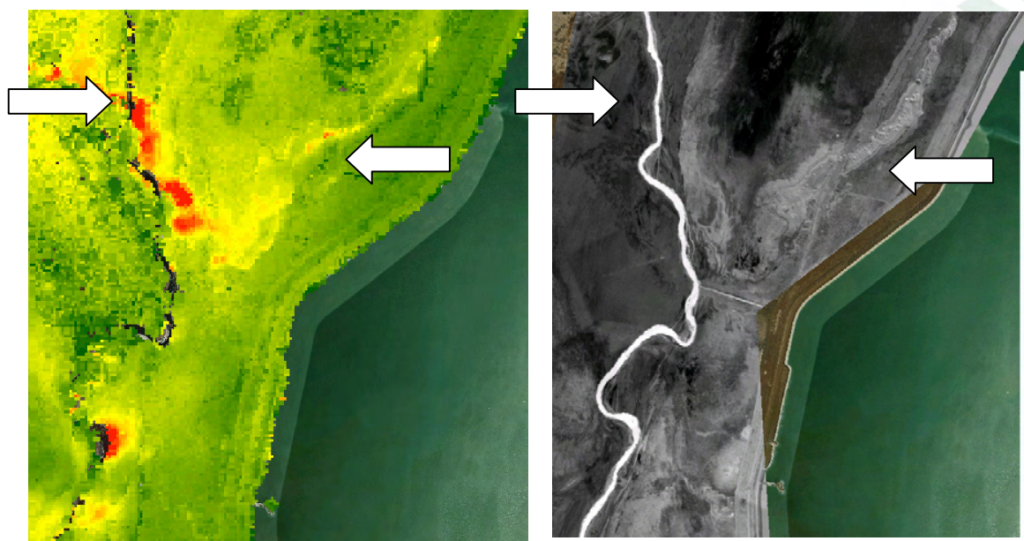
Figure 4: Structural problem zones visible in the Radar-Interferometry data correlating with results from the thermal mapping in the older area (right arrow), but are not yet visible in the new depression (left arrow) – identification of geological fault lines not yet eroded by underground water.

Figure 5: Multiple sensors are showing a line sink holes in the pond (arrow), seepages of water underneath the dyke (thermal mapping, purple), and depressions on the wadi (mapped with Lidar and Radar Interferometry – magnified picture)
DIMAP HK Pty Ltd, © 2014